Dashboard Templates

Discover our comprehensive ecommerce solutions designed to streamline your online business, enhance customer experiences, and boost your sales. Our cutting-edge technology integrates seamlessly with your existing systems to provide an all-in-one platform for managing products, orders, payments, and more.

This dashboard shows the current inventory level and reorder point for different product categories. Additionally, it presents a line chart tracking the stock in and stock out trends over time, and a table detailing the inventory level, reorder point, and difference for each product category by store. Finally, it includes a bar chart comparing the stock in and stock out quantities for each product category.

This dashboard shows the brand search, brand mentions, total customers, and total budget, along with their percentage changes. Additionally, it presents line charts for brand search and brand mentions, customer acquisition growth, LinkedIn marketing performance, and display marketing performance. Further, it includes a pie chart for NPS (Net Promoter Score) and a table with demographic breakdowns for LTV to CAC ratio and total budget.

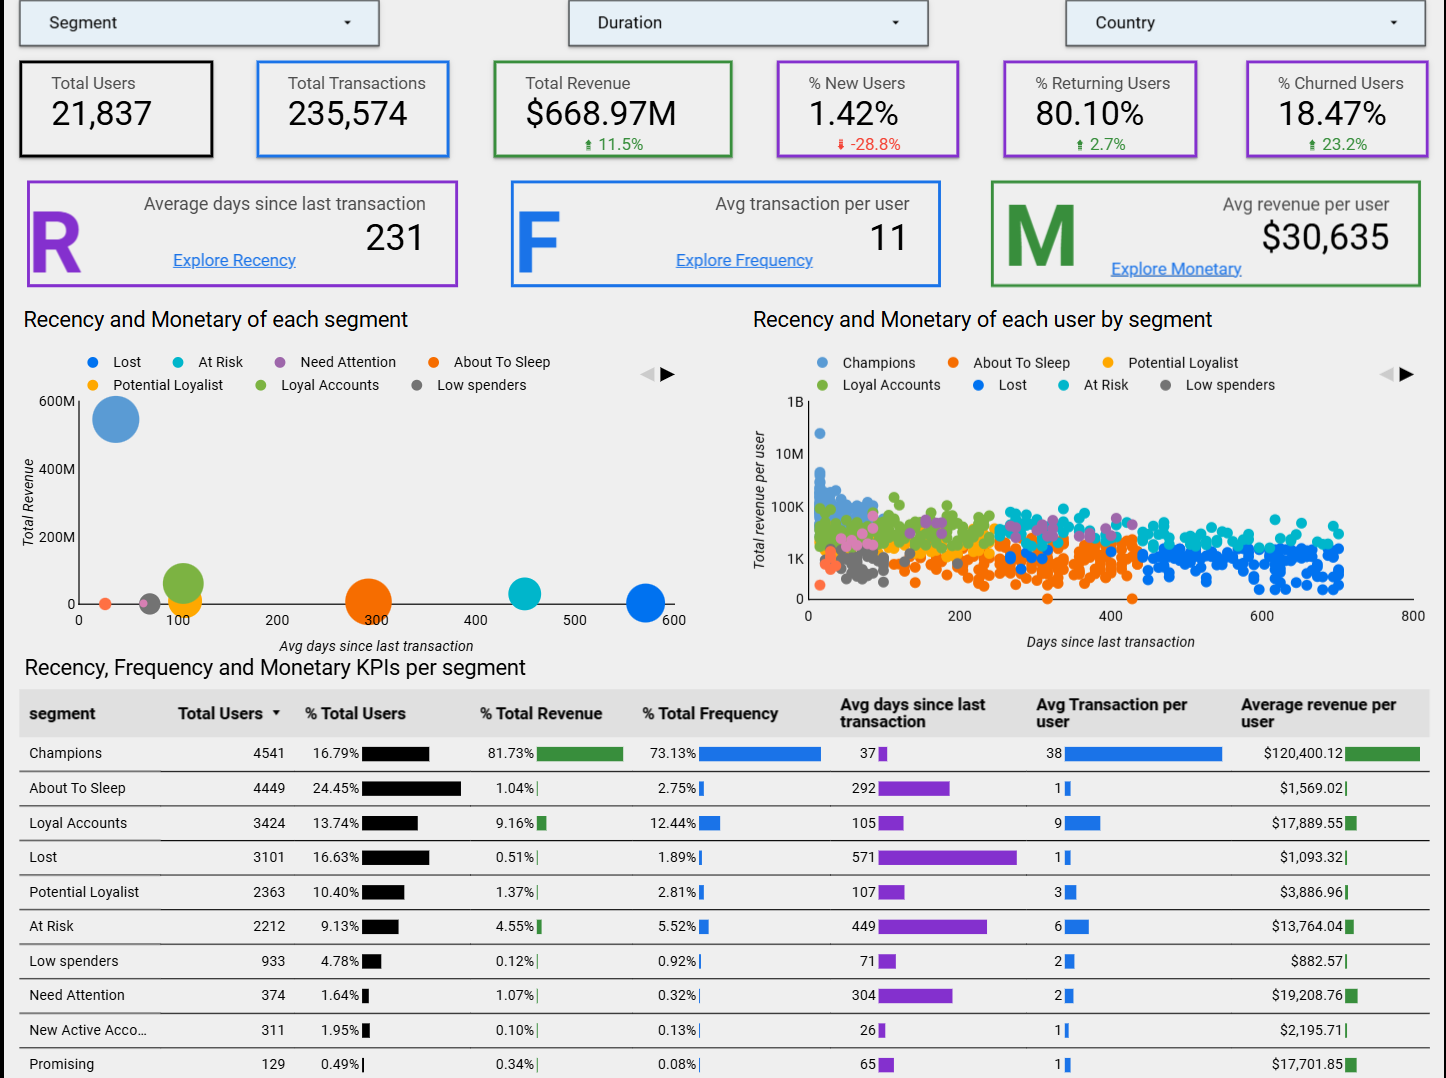
This dashboard shows the total users, total transactions, total revenue, and percentage of new, returning, and churned users. Additionally, it presents charts for recency and monetary analysis of each segment and user, as well as a table with key metrics like average days since last transaction, average transaction per user, and average revenue per user for each segment. Finally, it includes a bar chart comparing the total users, percentage of total users, total revenue, and total frequency for each segment.
This dashboard shows the total users, user acquisition trend line, and key performance indicators (KPIs) by user acquisition month. The KPIs include user acquisitions, acquisition growth, cumulative users, new users, returning users, churned users, macro loyal users, macro promising users, and macro sleep users. The dashboard also includes a table with detailed data on these KPIs for each month.

This dashboard shows the total users, total transactions, total revenue, and percentage of top spenders, one-time customers, and churned users. Additionally, it presents a table with key metrics for each customer segment, including RFM (Recency, Frequency, Monetary) segment description, retention strategy, CLV (Customer Lifetime Value) category, CLV, days since last transaction, total transactions, total revenue, and lifetime months.

This dashboard shows the total sales by country, state, city, and store, along with their percentage changes. Additionally, it presents a pie chart for total sales by product type, a map showing sales by geo locations, and a bar chart for month-over-month sales.

This dashboard shows the change in total sales for products, age groups, brands, and departments between 2022 and 2023. Additionally, it presents bar charts comparing the sales for each category in the two years.

This dashboard shows the total sales, quantity ordered, cancelled orders, and unique orders, along with their percentage changes. Additionally, it presents line charts for sales and orders, a bar chart for sales by discount code, a table for top products sold, a chart for orders by channel, and a table for this week's order details.

This dashboard shows the total order cost, total quantity ordered, days late by average late days, and percentage accepted for December 2023. Additionally, it presents line charts for total order cost and total quantity ordered over time. The dashboard also includes bar charts for total quantity ordered and total order cost by country and product type.

Highlights top-performing branches based on annual revenue, expenses, deposits, and efficiency ratios. Compares actual performance with targets for revenue, expenses, and net interest margins, helping monitor branch-level profitability and operational effectiveness.

Analyzes account decay rates and their impact on balances over time. Provides insights into retention rates, actuarial life table calculations, and the average balance trends, aiding in long-term planning and account management.

Displays detailed profitability metrics for customer accounts, including annual profit, net income, incremental profits, and expenses. Facilitates identification of high-value and low-performing accounts for targeted strategies.

This dashboard visualizes the progress toward deposit targets, breaking down actuals against goals by region, branch, or customer segment. It provides actionable insights into performance gaps and areas requiring attention.

This high-level dashboard offers a comprehensive overview of key performance metrics such as revenue, growth rates, and financial targets, enabling executives to monitor the institution's overall health and strategic alignment.

This dashboard tracks loan portfolio performance, highlighting metrics like approval rates, delinquencies, and repayment trends across different regions or customer demographics, facilitating risk management and decision-making.

This dashboard shows the total assets, cash flow, income statement, and liabilities, along with their percentage changes. Additionally, it presents a trend line graph for each metric over time and a table highlighting the branch with the highest assets and its associated financial details.

This dashboard shows the total accounts, outstanding loan balance, average interest rate, average loan term, and active loans. Additionally, it presents distribution charts for outstanding balance by age category, available credit by age group, and account status distribution. Further, it includes a scatter plot showing the correlation between FICO score and interest rate, and a pie chart illustrating the loan type distribution.

This dashboard shows the total deposits, loan growth, deposit growth, and revenue growth, along with their percentage changes and progress towards annual goals. Additionally, it presents circular gauges for net profit, net interest margin, customer acquisition growth, return on equity, ESG loan growth, branch reduction, cost-to-income ratio, non-performing loans, staff efficiency, customer retention rate, digital banking adoption, and regulatory capital ratio, all with their respective values and progress towards annual goals.
This dashboard shows the total accounts, total relationship, total net income, and total provision expense. Additionally, it presents a bar chart comparing average annual profit and average net income by branch, along with box plots to visualize the distribution of total relationship, annual profit, and net income across the branches.

This dashboard shows the total delinquent accounts, high-risk accounts, average interest rate, and loans entered last week. Additionally, it presents bar charts comparing the number of delinquent accounts and the delinquent loan amount by state and by branch. Further, it includes a table with detailed information about delinquent accounts, including customer name, account status, loan type, date entered, age, current balance, annual profit, interest rate, APR, LTV ratio, collateral value, and FICO score.
Tracks growth in current, savings, and term deposits over time, showcasing key metrics such as CAGR, average deposits, and growth rates. Visualizes trends in deposits across multiple time frames and evaluates year-on-year performance for different account types.

This dashboard shows the total sales, quantity ordered, cancelled orders, and unique orders, along with their percentage changes. Additionally, it presents line charts for sales and orders, a bar chart for sales by discount code, a table for top products sold, a chart for orders by channel, and a table for this week's order details.
We empower businesses with data insights. Leverage our data analytics solutions to stay ahead in a competitive world.
A 1201 Ekta Festival, 132 Feet Ring Road, Naranpura, Ahmedabad
+91 9011719639
bhavik@analytixware.in